§ 5 — Weather
Weather
Why weather matters to a small drone, how the atmosphere behaves, how to decode METAR and TAF, and how to decide not to fly.
Weather is about five percent of the knowledge test: three scored questions in a sitting of sixty. PSI UAG Applicant Information Bulletin (eff. 2025-09-29), p. 4 It is also the least familiar material in the course. Regulations are rules and airspace is a map, but weather is a physical system that you have to recognize from a line of code, and the code is unforgiving: 32005KT means exactly one thing.
So this chapter does the physics first, briefly, because each piece predicts something you will be asked to read. Then it teaches the codes, once you know what they are reporting.
§ 5.1 — WHY WEATHER MATTERS
Why weather matters to a small drone
A passenger jet treats a 30-knot wind as a scheduling problem. A small drone treats it as the main event, because wind and aircraft speed are the same kind of number and the smaller the aircraft, the bigger the share the wind takes. Suppose yours can fly 30 knots through the air and the wind is 20: into the wind you creep along at 10 knots, and with the wind behind you cover the ground at 50. That second number is the one the regulation cares about, because the speed limit is written in groundspeed, 87 knots. A tailwind eats your margin while the airspeed looks modest. 14 CFR § 107.51(a)
Weather reaches a small drone through five doors. Wind is the first. Temperature is the second: the FAA’s advisory circular lists high and low operating temperature limits among the things a manufacturer should publish, and names extreme heat as one way a lithium battery gets into trouble. AC 107-2A, ¶ 8.12.2.5.1 and App. B.5 Cold does the opposite damage, since a cold battery cannot deliver the current you ask of it. Third is precipitation, where the circular encourages manufacturers to publish “weather limitations to include wind, precipitation, and maximum wind gusts.” AC 107-2A, ¶ 8.12.2.5.1 Fourth is air density, which sets how much thrust a propeller finds, and gets its own section near the end. Fifth is visibility, where the rules live.
The visibility and cloud rules
You need at least 3 statute miles of flight visibility, measured from the control station, and your aircraft must stay at least 500 feet below any cloud and at least 2,000 feet from it horizontally. 14 CFR § 107.51(c), (d) Stay 500 below and 2,000 beside any cloud. Not because the rule is arbitrary: a manned aircraft can drop out of that cloud at 150 knots with no way to see you. The buffer is the time it takes a pilot to spot and avoid a small object.
The two limits combine into something the regulation never says out loud. At the 400-foot ceiling you are legal only if the cloud base is at least 900 feet above the ground, because 400 plus 500 is 900. An overcast at 800 feet means you can fly no higher than 300. This is arithmetic on the rules, not a new rule, and it is a common way for a pleasant-looking morning to turn out illegal. 14 CFR § 107.51(b), (d)
A weather report’s visibility is also not your flight visibility: the report gives the prevailing visibility at an airport, and yours is what you can see from where you stand. The advisory circular says to use the closest reporting station that represents your terrain, and that if no local report exists you cannot fly until you can establish visibility and cloud clearance by other reliable means. AC 107-2A, ¶ 5.12.3 Local weather is also the first of the four things your preflight assessment must include. 14 CFR § 107.49(a)(1)
§ 5.2 — THE ATMOSPHERE
The atmosphere the test assumes
Every aviation weather number is measured against a reference atmosphere, so that a number means the same thing in Alaska and Florida. Standard sea-level pressure is 29.92 inches of mercury, which is 1,013.2 millibars, and standard sea-level temperature is 15 degrees Celsius, or 59 Fahrenheit. FAA-H-8083-25C, Ch. 12 (Measurement of Atmosphere Pressure)
| Sea-level pressure | 29.92 "Hg = 1,013.2 mb | FAA-H-8083-25C, Ch. 12 |
|---|---|---|
| Sea-level temperature | 15 °C = 59 °F | FAA-H-8083-25C, Ch. 12 |
| Temperature change with height | about 2 °C (3.5 °F) colder per 1,000 ft | FAA-H-8083-25C, Ch. 12 |
| Pressure change with height | about 1 "Hg lower per 1,000 ft | FAA-H-8083-25C, Ch. 12 |
| Top of the weather layer (tropopause) | 36,089 ft in the standard atmosphere | FAA-H-8083-28B, Table 4-2 |
Carry the lapse rate and the pressure change in your head. Climb 1,000 feet in the standard atmosphere and it gets about 2 degrees colder and the pressure drops about an inch. A quick use: standard temperature at 5,000 feet is 15 minus 10, so 5 degrees. If it is actually 25 there, the air is 20 degrees warmer than standard and thinner than the altitude suggests. (The handbook states the lapse rate as 6.5 degrees per 1,000 meters, which is 1.98 per 1,000 feet, so “2 per 1,000” is a rounding.) FAA-H-8083-28B, Ch. 4.4 (The Standard Atmosphere)
Pressure
Pressure is the weight of the air above you: a column one square inch across weighs 14.7 pounds at sea level, and about half that at 18,000 feet, where half the air is below you. FAA-H-8083-25C, Ch. 12 (Atmospheric Pressure) That is why pressure falls with height, and why thin air gives a propeller less to work with.
Stations correct for their own height by adding roughly one inch per 1,000 feet of elevation, so a station at 5,000 feet reading 24.92 reports 29.92. FAA-H-8083-25C, Ch. 12 (Measurement of Atmosphere Pressure) The result is the altimeter setting, the A2992 in a METAR. Pressure also hints at what is coming: steadily rising pressure generally means fair weather, and rapidly falling pressure usually means bad weather, possibly severe. FAA-H-8083-25C, Ch. 12 Nearly all weather lives in the lowest layer, the troposphere. For a drone under 400 feet, what matters is the bottom few hundred feet, where ground, buildings and trees disturb the air most.
§ 5.3 — WIND
Wind
Wind exists because the sun heats the Earth unevenly. Warm air expands, becomes less dense and rises; cooler air flows in to replace it. The result is pressure differences, and air flows from higher pressure toward lower, trying to even them out. FAA-H-8083-25C, Ch. 12 (Wind and Currents) The push is called the pressure gradient force, and wind speed is proportional to it. On a weather map pressure is drawn as isobars, lines of equal pressure: where they crowd together the wind is strong, and where they spread out it is light. FAA-H-8083-28B, Ch. 10.3.1 Wind is always named for where it comes from: a 270-degree wind is a west wind, blowing toward the east. FAA-H-8083-28B, Ch. 10.2
The Coriolis sentence
Air would flow in straight lines from high to low except that the Earth rotates beneath it. The apparent deflection is the Coriolis force, and the one sentence the test likes is this: the Coriolis force deflects moving air to the right in the Northern Hemisphere. It is zero at the equator, greatest at the poles, and grows with the speed of the air. FAA-H-8083-25C, Ch. 12 (Coriolis Force) The consequence is the spin on weather maps: air bent to the right as it leaves a high circulates clockwise around it, and air bent to the right as it enters a low circulates counterclockwise. High pressure generally means dry, descending air and good weather; low pressure means air converging and rising, with clouds and precipitation. FAA-H-8083-25C, Ch. 12 (Wind Patterns)
Near the ground
Friction slows and turns the wind in the lowest 2,000 feet or so; the wind 2,000 feet up is typically 20 to 40 degrees to the right of the surface wind, and stronger. FAA-H-8083-25C, Ch. 12 (Wind and Pressure Representation on Surface Weather Maps) Uneven surfaces matter too. Plowed ground, rock, sand and bare land give off heat and send up rising air, while water and vegetation stay cooler. These convective currents make low-altitude air bumpy and can reduce your control of a light aircraft. AC 107-2A, App. B.4.2 At a coastline the same principle makes the sea breeze by day and the land breeze at night. FAA-H-8083-25C, Ch. 12 (Convective Currents)
A gust is a variation of 10 knots or more between the peaks and lulls of the wind. FAA-H-8083-28B, Ch. 10.7.2 The speed in a report is the average; the gust is the top of the swings, so a drone happy in a steady 15 knots can be in real trouble in 15 gusting 28.
Anything that sticks up from the ground breaks the wind into eddies. This mechanical turbulence is what you meet behind a building, a tree line or a hill; it worsens with wind speed, rough surface and a big obstacle, and the eddies are carried downstream. FAA-H-8083-28B, Ch. 19.2.2 The advisory circular tells you to be vigilant near large buildings and natural obstructions such as mountains, bluffs and canyons. AC 107-2A, App. B.4.1
Mountains do it with a bias. Wind rises smoothly up the windward side, and the upward current can carry an aircraft over the crest. On the lee side the air tumbles down the slope, increasingly turbulent, pressing an aircraft toward the terrain. FAA-G-8082-22, Ch. 3b (Effect of Obstructions on Wind) Mountaintop wind over 25 knots suggests turbulence, and over 40 across a barrier calls for caution; smooth lens-shaped clouds standing still over a ridge mark a mountain wave and strong turbulence. FAA-G-8082-22, Ch. 3b (Mountain Flying)
Wind shear
Wind shear is a sudden, drastic change in wind speed or direction over a very small area. It can occur at any altitude but is most dangerous low down, and the FAA associates it with passing fronts, thunderstorms, temperature inversions and winds aloft above 25 knots. A tailwind turning into a headwind raises airspeed and performance; a headwind turning into a tailwind lowers both. It often goes unreported, so assume it near thunderstorms and fronts. FAA-G-8082-22, Ch. 3b (Low-Level Wind Shear)
§ 5.4 — STABILITY
Stability and instability
Stability is whether the air resists being pushed up or down. In a stable atmosphere a small vertical disturbance dies out. In an unstable one it grows: displaced air keeps rising by itself, and turbulence, tall clouds and storms follow. FAA-G-8082-22, Ch. 3b (Atmospheric Stability) Which kind you have decides what the sky looks like and how it feels. The pairs below come in matched sets; memorize them together.
| Clouds | Stable: stratus (layers) and fog. Unstable: cumulus (heaped). | FAA-G-8082-22, Ch. 3b |
|---|---|---|
| Precipitation | Stable: steady. Unstable: showery. | FAA-G-8082-22, Ch. 3b |
| Air motion | Stable: smooth. Unstable: rough, turbulent. | FAA-G-8082-22, Ch. 3b |
| Visibility | Stable: fair to poor, in haze and smoke. Unstable: good, except in blowing obstructions. | FAA-G-8082-22, Ch. 3b |
Why air becomes unstable
Rising air expands as the pressure around it drops, and expanding air cools; sinking air is compressed and warms. This change with no heat added or removed is called adiabatic. Dry rising air cools about 3 degrees Celsius per 1,000 feet, and moist air that has begun to condense cools more slowly, between about 1.1 and 2.8. FAA-H-8083-25C, Ch. 12 (Atmospheric Stability)
Lift a pocket of air and compare it with its surroundings. If the pocket is colder, and so denser, it sinks back: stable. If it stays warmer, it keeps rising on its own: unstable. FAA-H-8083-28B, Ch. 13.2 The steeper the real temperature drop with height, the less stable the air. Cool, dry air is very stable and gives clear weather; warm, moist air is the most unstable, which is why tropical summer afternoons make a thunderstorm nearly every day. FAA-G-8082-22, Ch. 3b Daytime heating also lowers stability and night cooling raises it, so the afternoon is the bumpy part of a summer day. FAA-H-8083-28B, Ch. 13.4.3
Inversions
Normally the air cools as you climb. When the temperature instead rises with altitude over some layer, you have a temperature inversion, usually a shallow layer of smooth, stable air near the ground. The warm air at the top acts as a lid, trapping weather and pollutants below it. If the humidity is high, the trapped air can form cloud, fog, haze or smoke and cut visibility. FAA-G-8082-22, Ch. 3b (Inversion)
The common kind forms on clear, cool nights, when the ground radiates its heat away and chills the air within a few hundred feet of it. A frontal inversion forms where warm air rides over cooler air. Strong wind shear often sits across an inversion. FAA-G-8082-22, Ch. 3b · FAA-H-8083-28B, Ch. 19.2.3.1
§ 5.5 — MOISTURE AND FOG
Moisture, dew point and fog
The spread between temperature and dew point
Air can hold only so much water vapor, and warm air holds more than cold. Relative humidity is how full the air is. The dew point is the temperature to which air must cool to be full; cool it that far and the vapor condenses into fog, dew, frost, cloud, rain or snow. FAA-H-8083-25C, Ch. 12 (Temperature/Dew Point Relationship) The gap between temperature and dew point is the spread. As it shrinks, relative humidity rises, and at zero the air is saturated. FAA-H-8083-28B, Ch. 6.6
That is why the temperature and dew point pair in a METAR, 18/17, is one of its most informative groups. The handbook’s rule: fog seldom forms when the spread is greater than 2 degrees Celsius (4 Fahrenheit). FAA-H-8083-28B, Ch. 18.1.1 and 6.6
The spread also gives a rough cloud base. Lifted unsaturated air cools 5.4 degrees Fahrenheit per 1,000 feet while its dew point falls about 1, so the two converge 4.4 degrees per 1,000 feet. Divide the spread in Fahrenheit by 4.4 and multiply by 1,000 for the cloud base in feet AGL: 85 and 71 is a spread of 14, 14 over 4.4 is 3.2, so about 3,200 feet. FAA-H-8083-25C, Ch. 12 A METAR is in Celsius, and one Celsius degree is 1.8 Fahrenheit degrees, so a field version is roughly 400 feet of cloud base per degree of spread. (That conversion is my arithmetic on the FAA’s figures, not an FAA rule.)
Air reaches saturation four ways: warm air moving over a cold surface, cold and warm air mixing, cooling at night against the ground, and being lifted. FAA-H-8083-25C, Ch. 12
Fog
Fog is a cloud whose base is on the ground, with visibility under 5/8 of a mile. FAA-H-8083-28B, Ch. 18.1.1 It is named for how it forms.
Radiation fog forms on clear, calm nights over land, when the ground radiates its heat away and chills the air to its dew point. It is shallow, collects in low places, and burns off after sunrise; fog under 20 feet thick is ground fog. FAA-H-8083-25C, Ch. 12 (Fog) Advection fog is the fog that arrives: moist air moving over a colder surface. Unlike radiation fog it needs wind, up to about 15 knots, can arrive at any hour, and persists far longer. FAA-H-8083-28B, Ch. 18.1.1.1.2 Upslope fog forms as moist, stable air is pushed up a slope and cools; it needs wind too, and may last for days. FAA-H-8083-25C, Ch. 12 (Fog) Steam fog, or sea smoke, forms when very cold air crosses warmer water, and sits in unstable air with low-level turbulence. FAA-H-8083-28B, Ch. 18.1.1.1.5 Precipitation-induced fog, the handbook’s frontal fog, forms when rain falling from warm air evaporates into cold air near the ground and saturates it; it is most common along warm fronts. FAA-H-8083-28B, Ch. 18.1.1.1.4
Frost, ceiling and visibility
On a cool, clear, calm night, surfaces cool below the dew point and moisture deposits as dew, or frost below freezing. Frost disrupts airflow, cuts lift and adds drag, and the FAA is explicit that a small UA must be cleared of frost before flight. FAA-G-8082-22, Ch. 3b (Dew and Frost)
For aviation, a ceiling is the lowest layer reported as broken or overcast, or the vertical visibility into an obscuration such as fog. Broken is five-eighths to seven-eighths of the sky; overcast is all of it; few or scattered clouds are not a ceiling. Visibility is the greatest horizontal distance at which prominent objects can be seen with the naked eye. FAA-G-8082-22, Ch. 3b (Ceiling · Visibility) Weather websites color-code the two into flight categories: IFR is a ceiling under 1,000 feet and/or visibility under 3 miles; MVFR, marginal VFR, is 1,000 to 3,000 feet and/or 3 to 5 miles; VFR is above 3,000 feet and above 5 miles. FAA-H-8083-28B, Ch. 3.4.2.14 These are for situational awareness only. They are not the Part 107 minimums: a station flagged MVFR can be legal for a drone, and a station flagged VFR can still have a scattered layer at 700 feet that you must stay 2,000 feet away from.
§ 5.6 — CLOUDS
Clouds
Clouds are visible forecasts, and they are sorted by the height of their bases, in round numbers that shift with latitude. Low clouds run from the ground to about 6,500 feet AGL: stratus, stratocumulus and nimbostratus, with fog counted as a low cloud. They make low ceilings and poor visibility and change quickly, so they matter to you most. Middle clouds, altostratus and altocumulus, run from 6,500 to 20,000 feet. High clouds, the cirrus family, are above 20,000, made of ice crystals, and pose no real turbulence or icing threat. The last family is clouds with vertical development, towering cumulus and cumulonimbus, whose bases are low but whose tops reach the high levels. FAA-H-8083-25C, Ch. 12 (Clouds)
Cumulus means heaped, stratus layered, nimbus rain-bearing, cirrus fibrous and high. A heaped cloud means the air is lifting, an unstable sign; a layered cloud means calm air, a stable one.
Towering cumulus is the cloud to take seriously. It marks instability, the air in and around it is turbulent, and it often becomes a cumulonimbus, which the FAA calls perhaps the most dangerous cloud to pilots: lightning, hail, tornadoes, gusty winds and shear, sometimes hidden inside other cloud. FAA-H-8083-25C, Ch. 12 (Clouds) In a METAR they appear as TCU and CB after a cloud layer. The cloud you must stay away from is the cloud you can see growing; the cloud clearance lesson lets you drag a drone around one and watch the legal envelope change.
§ 5.7 — THUNDERSTORMS
Thunderstorms
A thunderstorm needs three things: enough water vapor, an unstable lapse rate, and an initial lift to start the air moving up. FAA-H-8083-25C, Ch. 12 (Thunderstorms) Heating of the surface makes an air mass thunderstorm, upslope motion over mountains makes an orographic one, and a continuous line of them is a squall line. FAA-G-8082-22, Ch. 3b (Clouds)
The three stages
A cell passes through three stages that are nearly impossible to tell apart by eye. FAA-G-8082-22, Ch. 3b (Thunderstorm Life Cycle) In the cumulus stage there is an updraft from near the ground to the cloud top, with growth that can exceed 3,000 feet per minute; do not operate a small UA near rapidly building cumulus. In the mature stage, precipitation begins to fall from the cloud base. It drags cold air down, so a downdraft appears beside the updraft and spreads out at the ground as a cold, gusty gust front. Updrafts can pass 6,000 feet per minute and downdrafts 2,500, and the shear between them is violent. All the hazards peak in this stage. In the dissipating stage downdrafts take over and the storm dies.
The hazards
You cannot tell from the ground which hazards a given storm holds, so assume all of them. FAA-H-8083-25C, Ch. 12 (Hazards) Turbulence is in every storm. The gust front can run 15 miles ahead of the rain, with a roll cloud marking an extremely turbulent zone. Hail can fall in clear air several miles from the storm and from beneath the anvil, and hail over half an inch across can seriously damage an aircraft in seconds. FAA-H-8083-25C, Ch. 12 (Hazards) Lightning can puncture an aircraft’s skin and damage its electronics. FAA-H-8083-25C, Ch. 12 (Lightning) The vortex under a severe storm is a funnel cloud if it does not reach the surface, a tornado if it touches land and a waterspout if it touches water. FAA-H-8083-25C, Ch. 12 (Tornadoes) The handbook’s rule is to stay at least 20 nautical miles from a severe storm, and if you cannot go around, to stay on the ground until it passes. FAA-H-8083-25C, Ch. 12 (Thunderstorms)
Microbursts
The most severe low-level wind shear is the microburst, a small, intense downdraft that spreads outward when it hits the ground. A typical one is 1 to 2 miles across and 1,000 feet deep, lasts 5 to 15 minutes, and produces downdrafts to 6,000 feet per minute and headwind losses of 30 to 90 knots. There is little warning: an intense rain shaft, virga at the cloud base, or only a ring of blowing dust. FAA-G-8082-22, Ch. 3b (Low-Level Wind Shear)
The sequence is the lesson. A small UA first meets a headwind, which raises airspeed and performance and tempts you to ease off; then the downdraft; then a rapidly increasing tailwind, just as the aircraft is being pushed toward the ground. FAA-G-8082-22, Ch. 3b (Low-Level Wind Shear)
§ 5.8 — ICING
Icing
Structural icing needs two things at once: the aircraft is in visible water such as rain or cloud droplets, and the temperature where the water strikes it is 0 degrees Celsius or colder. An airfoil cools slightly as it moves, so it can reach 0 even when the air is a few degrees warmer. FAA-G-8082-22, Ch. 3b (Structural Icing) Cloud droplets can stay liquid well below freezing and freeze the instant they are struck. Rime ice is rough and milky; clear ice is glossy, denser and hard to see, and the more dangerous; mixed is both. Most icing occurs between 0 and minus 20, and it is cumulative. FAA-H-8083-28B, Ch. 20.2 to 20.3.4
Induction icing affects the air intake rather than the airframe. The classic case is carburetor ice, where vaporizing fuel and the pressure drop cool the air by as much as 60 to 70 Fahrenheit degrees, enough to freeze moisture inside the carburetor on a mild day. FAA-H-8083-28B, Ch. 20.4.1 Most small UAS are electric and have none, but a gasoline-powered one does.
For a small UA the practical message is blunt. You have no ice protection, so you do not fly in visible moisture near freezing, and you clear frost before launch. Ice pellets are a clue that rain fell through an inversion and freezing rain is present higher up. FAA-H-8083-25C, Ch. 12 (Precipitation)
§ 5.9 — FRONTS
Air masses and fronts
An air mass is a large body of air that takes on the temperature and moisture of the region it sat over, described as polar or tropical for temperature and maritime or continental for moisture. As it moves, it is modified from below. Over a warmer surface it is heated, develops convective currents and becomes unstable, with good visibility, and if moist, cumulus, showers and turbulence. Over a colder surface it becomes stable, smoke and dust cannot rise out of it, and you get poor visibility, low stratus and fog. FAA-H-8083-25C, Ch. 12 (Air Masses)
A front is the boundary between two air masses, named for the temperature of the advancing air relative to the air it replaces. An approaching front of any type means changes are imminent. FAA-H-8083-25C, Ch. 12 (Fronts)
Cold front
A cold front is cold, dense air advancing under warmer air like a snowplow, forcing it sharply upward. The lift builds clouds fast, so the weather is concentrated along the front. Before it comes towering cumulus, a high dew point and falling pressure. At passage the visibility is poor, the wind gusty and variable, with heavy showers, lightning, possibly hail or tornadoes, a quick drop in temperature and dew point, and pressure bottoming out. Behind it the clouds break up, the visibility is good, the wind comes from the west-northwest, and the air is cooler. A fast front squeezes this into a narrow band, and a squall line may form along or ahead of it. FAA-H-8083-25C, Ch. 12 (Cold Front)
Warm front
A warm front is warm air advancing over colder air. It moves slowly, 10 to 25 miles per hour, and the warm air slides up a gentle slope, so it announces itself: cirrus, then thickening layers, then nimbostratus, with steady rain or drizzle, low ceilings, poor visibility, fog and falling pressure. After passage the temperature rises and visibility slowly improves. FAA-H-8083-25C, Ch. 12 (Warm Front) Side by side: a cold front is fast, steep and violent, with sudden storms and clearing behind; a warm front is slow, shallow and wet, with days of warning. For a drone pilot, a cold front is the afternoon you cancel and a warm front is the morning you cannot see across the field. FAA-H-8083-25C, Ch. 12 (Comparison of Cold and Warm Fronts)
Stationary and occluded fronts
When two air masses are about equally matched, the boundary stalls: a stationary front influences local weather for days, with a mixture of warm and cold front weather. An occluded front forms when a fast cold front catches a slow warm front, bringing warm-front weather immediately followed by cold-front weather. FAA-H-8083-25C, Ch. 12 (Stationary Front · Occluded Front) On a chart, cold fronts are blue, warm red, stationary alternating red and blue, and occluded purple. FAA-H-8083-25C, Fig. 12-24
§ 5.10 — WEATHER SOURCES
Where weather information comes from
The FAA does not expect a remote pilot to forecast. It expects you to find official products, read them correctly, and decide.
Briefings: 1800wxbrief.com and aviationweather.gov
The advisory circular names two places. Flight Service runs 1800wxbrief.com, where a remote pilot can make a free account and get a briefing; its telephone service is for manned-aircraft pilots only. The National Weather Service’s Aviation Weather Center runs aviationweather.gov, which is free, needs no registration, and carries METARs, TAFs and the other products a remote PIC needs. Also check temporary flight restrictions at tfr.faa.gov. AC 107-2A, App. B.3 The site hosts the Graphical Forecasts for Aviation tool, a set of web displays giving a complete picture of the weather affecting a flight. FAA-H-8083-28B, Ch. 3.3.3
A briefing comes in types. A standard briefing is the most complete and the one to use when planning. An abbreviated briefing updates an earlier one when departure is delayed. An outlook briefing is for a departure six or more hours away and is limited in scope, so follow it with a standard briefing near the time. FAA-H-8083-25C, Ch. 13 (Weather Briefings)
Automated observing: ASOS and AWOS
Most surface reports now come from machines. ASOS, the Automated Surface Observing System, is a joint NWS, FAA and DOD program and the primary surface network. It issues hourly and special reports and broadcasts voice reports by radio and telephone. AWOS, the Automated Weather Observing System, is similar but simpler; capability depends on the type, from altimeter-only up to one that detects freezing rain. An AWOS makes a METAR every 20 minutes and issues no special reports. FAA-H-8083-28B, Ch. 24.3 Two details help. Automated stations average, sky over 30 minutes and visibility over 10, in a way designed to report deterioration faster than improvement. And they see cloud only to 12,000 feet, so CLR means no cloud detected at or below that, not a clear sky. FAA-H-8083-28B, Ch. 24.3.1 and 24.4.3.9
Pilot reports (PIREP)
A PIREP carries what no airport instrument can: the real heights of cloud bases and tops, and where the turbulence and icing are. Each element begins with a slash code and the order is fixed. FAA-H-8083-25C, Ch. 13 (Pilot Weather Reports)

Read the supplement’s example code by code. UA is a routine report (UUA is urgent). /OV KOKC-KTUL is the location, along the route between those airports. /TM 1800 is 1800 UTC. /FL120 is 12,000 feet. /TP BE90 is the aircraft type. /SK BKN018-TOP055/OVC072-TOP089/CLR ABV is a broken layer from 1,800 to 5,500 feet, an overcast layer from 7,200 to 8,900, and clear above. /TA M7 is minus 7 Celsius. /WV 08021 is wind from 080 degrees at 21 knots. /TB LGT 055-072 is light turbulence between 5,500 and 7,200 feet. /IC LGT-MOD RIME 072-089 is light to moderate rime icing from 7,200 to 8,900. FAA-H-8083-28B, Ch. 24.5.1 Two traps: PIREP altitudes are mean sea level, where METAR cloud heights are above ground level; and PIREP wind is relative to magnetic north, where METAR wind is true.
Winds and temperatures aloft (FB)
This forecast gives wind and temperature at fixed altitudes for specific stations, based on balloon soundings at 0000Z and 1200Z. Direction is true, speed is in knots, temperature is Celsius, and no winds are given within 1,500 feet of the station elevation. FAA-H-8083-25C, Ch. 13 (Winds and Temperature Aloft Forecast)
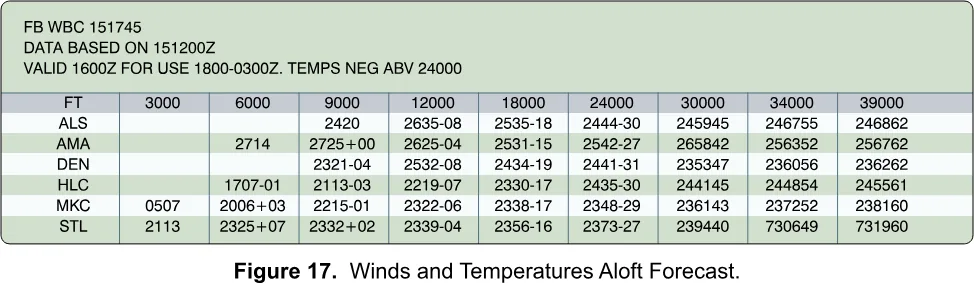
Four digits are wind: 2714 is from 270 at 14 knots. Six characters add temperature: 2321-04 is 230 at 21 knots, minus 4. Above 24,000 feet the minus sign is dropped because every temperature is negative, as the heading says. Winds of 100 knots or more are coded by adding 50 to the direction and subtracting 100 from the speed, so 731960 is 230 degrees at 119 knots, minus 60. 9900 is light and variable. FAA-H-8083-25C, Ch. 13 (Winds and Temperature Aloft Forecast) For a 400-foot flight these are a hint, not a measurement; but strong wind aloft over a calm surface is the setup for low-level shear.
Weather charts and advisories
The surface analysis chart shows current pressure systems, fronts, temperatures, dew points and winds. The weather depiction chart summarizes surface conditions from METARs every 3 hours. The significant weather prognostic chart forecasts hazards. FAA-H-8083-25C, Ch. 13 (Weather Charts)
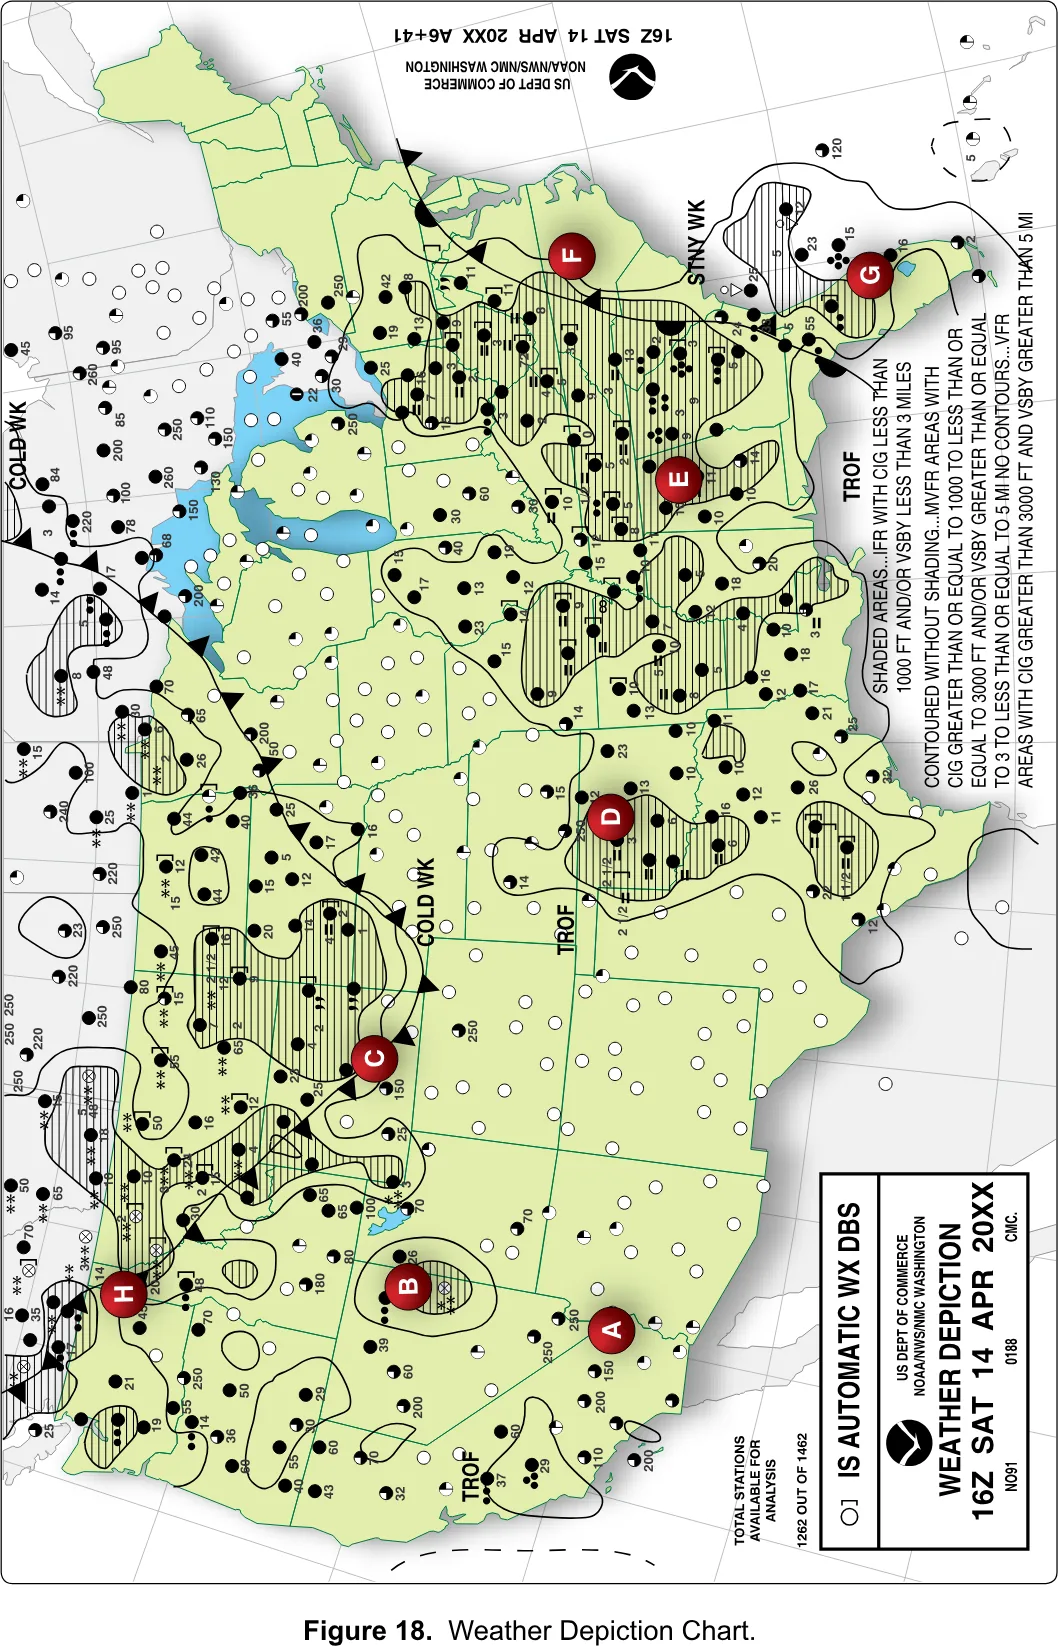
The depiction chart’s legend is the testable part. Shaded areas are IFR (ceiling under 1,000 feet and/or visibility under 3 miles). Contoured areas without shading are MVFR (1,000 to 3,000 feet and/or 3 to 5 miles). Unoutlined areas are VFR. FAA-CT-8080-2H, Fig. 18 · FAA-H-8083-25C, Ch. 13 (Weather Depiction Chart) It is a quick map of where the low weather is, but too coarse to speak for your field.
Recognize the advisories by name. An AIRMET warns of moderate icing or turbulence, sustained surface winds of 30 knots or more, and widespread low ceilings or visibility (Sierra is IFR and mountains, Tango is turbulence, strong surface wind and low-level shear, Zulu is icing). A SIGMET covers more severe hazards not tied to thunderstorms, and a convective SIGMET covers severe or embedded thunderstorms and tornadoes. FAA-H-8083-25C, Ch. 13 (Inflight Weather Advisories)
§ 5.11 — METAR
Reading a METAR
A METAR is a surface observation in a fixed international code, issued about hourly. A SPECI, a special report, comes out any time something significant changes: a wind shift, visibility crossing 3, 2, 1, 1/2 or 1/4 mile, a thunderstorm starting, the ceiling crossing 3,000, 1,500, 1,000 or 500 feet. FAA-H-8083-28B, Ch. 24.4 The groups always appear in the same order, so you never lose your place. Here is a short one.
KMDW 121856Z 32005KT 1 1/2SM RA OVC007 17/16 A2980Token by token
Type and station. METAR or SPECI comes first, though websites often drop it. Then a four-letter ICAO station: in the contiguous states a K plus the usual three letters, so Midway is KMDW. Alaska identifiers begin PA and Hawaii’s PH. FAA-H-8083-28B, Ch. 24.4.3.1-2
Date and time. 121856Z is the 12th day at 18:56 UTC. The Z is Zulu, UTC, the one clock all of aviation shares; it is not your local time, and forgetting that is the oldest mistake in the field. An optional modifier follows: AUTO means fully automated, COR a correction. FAA-H-8083-28B, Ch. 24.4.3.3-4
Wind. 32005KT is direction, speed, KT: from 320 degrees true at 5 knots, a two-minute average. A west wind at 20 gusting to 35 is 27020G35KT. VRB03KT is variable at 3 knots (VRB is used at 6 knots or less). Above 6 knots with direction swinging 60 degrees or more, a second group follows: 21010KT 180V240. 00000KT is calm. FAA-H-8083-28B, Ch. 24.4.3.5 The national network reports wind in true degrees, while radio and telephone broadcasts from ASOS and AWOS give magnetic, which is why the FAA’s sample question on the KJFK wind makes you choose between true and magnetic. FAA-H-8083-28B, Ch. 24.3.1.2 · FAA UAG Sample Questions, Q26
Visibility. 1 1/2SM is one and a half statute miles; a space separates whole number from fraction. An automated M1/4SM means less than a quarter mile. In a forecast, P6SM means greater than 6. This is prevailing visibility, the greatest distance seen over at least half the horizon, not your flight visibility. FAA-H-8083-28B, Ch. 24.4.3.6 When visibility is a mile or less, a station with the equipment adds runway visual range such as R17L/2600FT: runway 17 left, 2,600 feet. You only need to recognize it. FAA-H-8083-28B, Ch. 24.4.3.7
Present weather. Built in a fixed order: intensity or proximity, descriptor, phenomenon. Intensity is - light, nothing for moderate, + heavy, and VC for the vicinity, 5 to 10 miles. Then descriptors (SH showers, TS thunderstorm, FZ freezing), then precipitation (RA, SN, DZ, GR) and obscurations (BR mist, FG fog, HZ haze, FU smoke). Read left to right: +TSRA is a heavy thunderstorm with rain, -SHSN light snow showers, FZFG freezing fog, VCTS a thunderstorm in the vicinity. No noteworthy weather means no group. FAA-H-8083-28B, Ch. 24.4.3.8 Fog is under 5/8 mile; mist is 5/8 to under 7; an automated station picks mist over haze when the spread is 2 degrees or less. FAA-H-8083-28B, Ch. 24.3.1.2
Sky condition. Layers run from lowest up, each an amount and a three-digit height in hundreds of feet above ground. OVC007 is overcast at 700. FEW is one to two eighths, SCT three to four, BKN five to seven, OVC all eight; SKC or CLR is clear; VV002 is vertical visibility of 200 feet into fog. An observer may append TCU or CB: SCT023TCU. The ceiling is the lowest BKN, OVC or VV; a scattered layer is not one. FAA-H-8083-28B, Ch. 24.4.3.9
Temperature and dew point. 17/16 is 17 Celsius and a dew point of 16. Below zero gets an M: 04/M02. Subtract the two: the spread is the most useful derived number in the report, and here it is 1, so cloud and fog are at the door. FAA-H-8083-28B, Ch. 24.4.3.10
Altimeter and remarks. A2980 is 29.80 inches, an A and four digits with the decimal removed. Compare it with A2992: a setting that falls from one report to the next means weather is coming. Everything after RMK is extra, such as RAB35, rain began 35 minutes past the hour, or PRESFR, pressure falling rapidly. FAA-H-8083-28B, Ch. 24.4.3.11-13
| Report type | METAR = routine, about hourly. SPECI = special, any time. | 24.4 |
|---|---|---|
| Station | Four letters: K plus three in the contiguous states; PA Alaska, PH Hawaii | 24.4.3.2 |
| Date and time | DDHHMMZ, always UTC | 24.4.3.3 |
| Modifier | AUTO = fully automated. COR = corrected. | 24.4.3.4 |
| Wind | dddffKT. From, true degrees. G = gust. VRB = variable. 00000KT = calm. | 24.4.3.5 |
| Variable direction | Over 6 kt and swinging 60 degrees or more: 180V240 | 24.4.3.5.3 |
| Visibility | Statute miles, SM. 1 1/2SM. M1/4SM = less than 1/4. | 24.4.3.6 |
| RVR | R17L/2600FT: runway, feet | 24.4.3.7 |
| Intensity | - light, none moderate, + heavy, VC vicinity (5 to 10 SM) | 24.4.3.8 |
| Descriptors | SH showers, TS thunderstorm, FZ freezing, BL blowing, DR low drifting, MI shallow, PR partial, BC patches | 24.4.3.8.3 |
| Precipitation | DZ drizzle, RA rain, SN snow, SG snow grains, IC ice crystals, PL ice pellets, GR hail, GS snow pellets, UP unknown | 24.4.3.8.4 |
| Obscuration | BR mist, FG fog, FU smoke, HZ haze, DU dust, SA sand, VA volcanic ash | 24.4.3.8.5 |
| Other | SQ squall, FC funnel cloud, +FC tornado or waterspout, SS sandstorm, DS dust storm | 24.4.3.8.6 |
| Sky cover | SKC or CLR clear; FEW 1-2 eighths; SCT 3-4; BKN 5-7; OVC 8; VV vertical visibility | 24.4.3.9 |
| Ceiling and height | Lowest BKN, OVC or VV; heights are three digits in hundreds of feet AGL | 24.4.3.9 |
| Temperature and dew point | TT/DD in Celsius, M = minus | 24.4.3.10 |
| Altimeter | A and four digits: A2992 = 29.92 inHg | 24.4.3.11 |
| Remarks | Begin with RMK | 24.4.3.12 |
The test’s METAR set, line by line
The supplement prints five reports in one figure, and the FAA’s sample questions use it. Decode every group of every line.
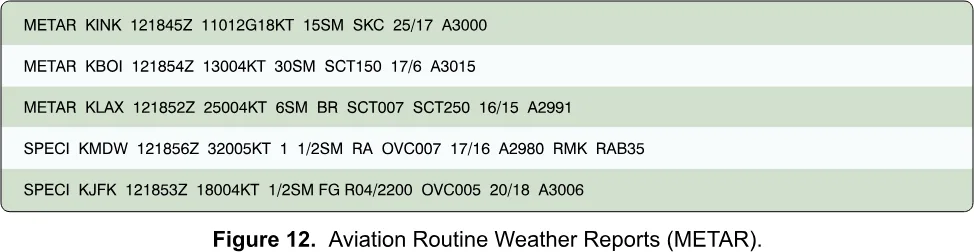
METAR KINK 121845Z 11012G18KT 15SM SKC 25/17 A3000. The 12th, 18:45 UTC. Wind from 110 at 12 knots gusting to 18. Visibility 15 miles. Clear sky. Temperature 25, dew point 17. Altimeter 30.00. A good day with one caveat: plan for the 18-knot peaks, not the 12.
METAR KBOI 121854Z 13004KT 30SM SCT150 17/6 A3015. Wind 130 at 4. Visibility 30 miles. Scattered at 15,000 feet, which is not a ceiling and is far above you. Temperature 17, dew point 6 (a live report pads it as 06). Altimeter 30.15, above standard. Easy flying.
METAR KLAX 121852Z 25004KT 6SM BR SCT007 SCT250 16/15 A2991. Wind 250 at 4. Six miles in mist. Scattered at 700 feet and at 25,000. Temperature 16, dew point 15, a spread of 1. The visibility clears 3 miles and nothing is a ceiling, but the 700-foot scattered layer matters: at 400 feet you are only 300 below it, so you must stay 2,000 feet away from it or fly no higher than 200 feet. With the spread at 1, the next report may be worse.
SPECI KMDW 121856Z 32005KT 1 1/2SM RA OVC007 17/16 A2980 RMK RAB35. A special report. Wind 320 at 5. One and a half miles in moderate rain. Overcast at 700, so the ceiling is 700. Altimeter 29.80. Rain began at 35 minutes past. That is the sample question’s answer for Chicago Midway: a 700-foot overcast, a mile and a half in rain. FAA UAG Sample Questions, Q25 Under Part 107, no flying: the visibility is under 3 miles.
SPECI KJFK 121853Z 18004KT 1/2SM FG R04/2200 OVC005 20/18 A3006. Wind from 180 true at 4 knots, the other sample question’s answer. Half a mile in fog. Runway 04 visual range 2,200 feet (the figure drops the FT). Overcast at 500. Temperature 20, dew point 18. A spread of 2 and a 500-foot ceiling: the textbook look of fog.
The METAR and TAF decoder lights up each token in turn and then checks you on fresh reports. Do a dozen; the second dozen go fast.
§ 5.12 — TAF
Reading a TAF
A METAR says what is; a TAF says what will be. A terminal aerodrome forecast covers the area within 5 statute miles of the center of an airport’s runway complex, in the same codes as a METAR. The NWS writes them for nearly 700 U.S. airports; most cover 24 hours and some major airports 30. They are issued four times a day, at 0000, 0600, 1200 and 1800Z, and amended whenever they stop being representative. A TAF has no temperature, and the only cloud type it includes is CB. FAA-H-8083-28B, Ch. 27.4
The header and the change groups
A TAF opens with its type (TAF, TAF AMD amended, TAF COR corrected), the station, and the issue time. Then comes the valid period, where beginners stumble: 1218/1324 is two day-and-hour pairs, from the 12th at 18Z until the 13th at 24Z. Hour 00 starts a day and 24 ends one, so a 24-hour forecast issued at 00Z on the 9th is 0900/0924. An amendment cancels the previous TAF at once. FAA-H-8083-28B, Ch. 27.4.2.1-4
The first line is the prevailing forecast: wind, visibility, weather, sky. Change groups then subdivide the period.
FM (from) marks a rapid, significant change, usually within an hour. FM122200 is “from the 12th at 2200Z.” Everything after replaces the earlier forecast until the next FM, and every element is restated. FAA-H-8083-28B, Ch. 27.4.2.10.1 TEMPO is a fluctuation with better than a 50 percent chance, an hour or less at a time, covering less than half the stated period. It carries only the elements that change: TEMPO 0513/0516 1 1/2SM BR means that at times between 13Z and 16Z the visibility drops to a mile and a half in mist, with wind and sky unchanged. FAA-H-8083-28B, Ch. 27.4.2.10.2 PROB30 is a 30 percent chance of a thunderstorm or precipitation event and its associated weather; it is the only probability group in NWS TAFs, while military and international TAFs may use PROB40. The study guide adds that PROB30 is not used in the first 6 hours of a 24-hour forecast. FAA-H-8083-28B, Ch. 27.4.2.10.3 · FAA-G-8082-22, Ch. 3a BECMG (becoming) is a gradual change over the window it names. The handbook’s NWS format does not include it and shows it only in joint-use airport TAFs, but the test supplement’s figure uses it, so know it: the conditions that follow are in place by the end of the window. FAA-H-8083-28B, Ch. 27.4.2.10.4
The test’s TAF set, line by line
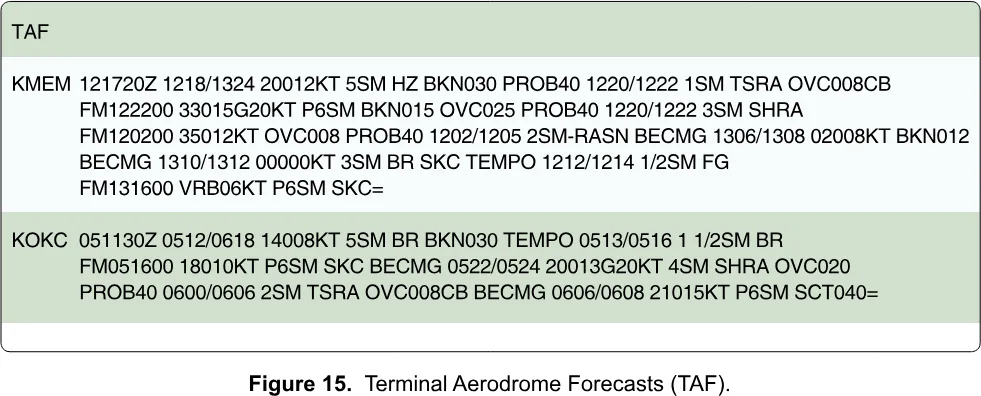
KMEM. KMEM 121720Z 1218/1324: issued the 12th at 17:20Z, valid from the 12th at 18Z to the 13th at 24Z. Prevailing: 20012KT 5SM HZ BKN030, wind 200 at 12, 5 miles in haze, ceiling 3,000 broken. PROB40 1220/1222 1SM TSRA OVC008CB: a 40 percent chance, 20Z to 22Z, of a mile in a thunderstorm with rain and overcast cumulonimbus at 800. FM122200 33015G20KT P6SM BKN015 OVC025 PROB40 1220/1222 3SM SHRA: from 22Z the wind is 330 at 15 gusting 20, visibility is over 6 miles, broken at 1,500 and overcast at 2,500, with a 40 percent chance of 3 miles in rain showers. FM120200 35012KT OVC008 PROB40 1202/1205 2SM-RASN: wind 350 at 12, overcast at 800, a 40 percent chance of 2 miles in light rain and snow. BECMG 1306/1308 02008KT BKN012: becoming, between 06Z and 08Z on the 13th, wind 020 at 8 and broken at 1,200. BECMG 1310/1312 00000KT 3SM BR SKC: becoming calm, 3 miles in mist, clear. TEMPO 1212/1214 1/2SM FG: at times, half a mile in fog. FM131600 VRB06KT P6SM SKC=: from 16Z on the 13th, variable wind at 6, over 6 miles, clear. The equals sign ends the forecast.
The figure is an exercise, not a live forecast, and some of its day-hour groups do not line up with the valid period: FM120200 taken literally falls before the forecast starts, TEMPO 1212/1214 precedes the first valid hour, and that last PROB40 names a window (20Z to 22Z) that is over before its FM group begins. Read the groups in the order they appear and decode their plain-language content; the questions ask about the conditions.
KOKC. KOKC 051130Z 0512/0618: issued the 5th at 11:30Z, valid from the 5th at 12Z to the 6th at 18Z, 30 hours. Prevailing: wind 140 at 8, 5 miles in mist, broken at 3,000. TEMPO 0513/0516 1 1/2SM BR: at times between 13Z and 16Z, a mile and a half in mist. FM051600 18010KT P6SM SKC: from 16Z wind 180 at 10, visibility over 6, clear. BECMG 0522/0524 20013G20KT 4SM SHRA OVC020: becoming, between 22Z and 24Z, wind 200 at 13 gusting 20, 4 miles in rain showers, overcast at 2,000. PROB40 0600/0606 2SM TSRA OVC008CB: 40 percent chance, 00Z to 06Z on the 6th, of 2 miles in a thunderstorm with overcast cumulonimbus at 800. BECMG 0606/0608 21015KT P6SM SCT040: becoming wind 210 at 15, over 6 miles, scattered at 4,000.
What a TAF gives you is the trend: if the ceiling is forecast to lower with thunderstorms probable by evening, that decides whether you drive to the site at all. It speaks only for the area within 5 miles of one airport, not for your field.
§ 5.13 — DENSITY ALTITUDE
Density altitude
An aircraft does not care about the altitude on the sign at the launch site; it cares about the density of the air it is flying in. Density altitude is the altitude in the standard atmosphere that has the same density as the air you actually have. Dense air means a low density altitude and good performance; thin air means a high one and poor performance. On a standard day it equals the field elevation, and conditions are rarely standard. FAA-H-8083-25C, Ch. 11 (Density Altitude)
High, hot and humid
Three things thin the air. Altitude lowers the pressure. Heat expands the air. And humidity, because water vapor is lighter than dry air. The worst case is a high field, low pressure, high temperature and high humidity; the best is a low field on a cold, dry, high-pressure day. FAA-G-8082-22, Ch. 3b (Density Altitude) Temperature is the biggest day-to-day swing; the handbook calls the dew point’s effect generally negligible. FAA-H-8083-28B, Ch. 8.4.1.5
What it does to the aircraft
The handbook lists three losses for a manned aircraft: less power, because the engine takes in less air; less thrust, because the propeller has less air to work with; and less lift, because thin air presses less on the wing. FAA-H-8083-28B, Ch. 8.4.1.5 An electric motor does not breathe air the way a piston engine does, so the first loss does not apply in the same way; the other two do. A propeller is a rotating wing, and in thin air it bites less, so the same motor effort makes less thrust and leaves you less margin for climbing and controlling the aircraft. The test asks it directly: high density altitude lowers propeller efficiency. FAA UAG Sample Questions, Q4 The advisory circular makes the same point about loading: high elevation, heat and humidity may require reducing weight before flight. AC 107-2A, App. B.2.1.1 And note that the 400-foot limit is above ground level, while density altitude depends on how high the ground itself is: a launch site at 8,000 feet has 8,000-foot air at zero AGL.
Finding it: pressure altitude, then the chart
Density altitude is pressure altitude corrected for temperature, so find pressure altitude first: the altitude your altimeter shows if set to 29.92. The supplement’s figure prints a conversion factor for each altimeter setting, which you add to the field elevation: plus 205 at 29.70, minus 165 at 30.10. Low pressure gives a positive factor, because the air is effectively higher than the sign says. FAA-H-8083-25C, Ch. 11 (Pressure Altitude) · FAA-CT-8080-2H, Fig. 8
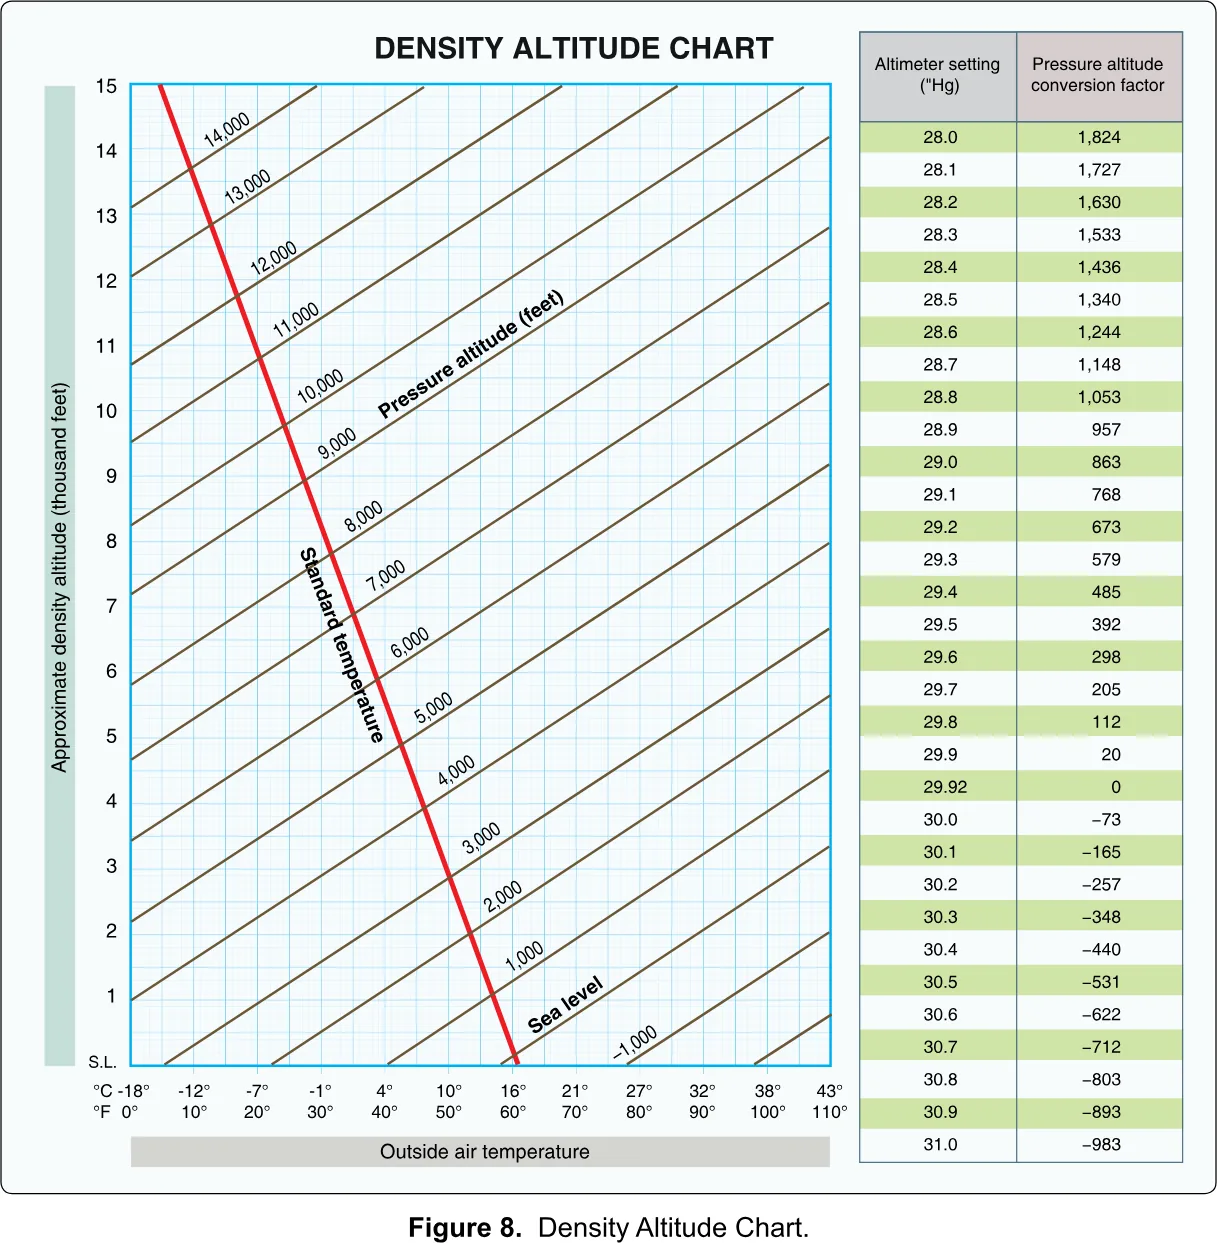
Then use the chart. Find the outside air temperature along the bottom, go straight up to the sloping line for your pressure altitude, then straight across to the left edge and read the density altitude. The PHAK works one example on its own copy of the chart: a field at 5,883 feet, 70 degrees Fahrenheit, altimeter 30.10. The factor is minus 165, so pressure altitude is 5,718, and the chart gives about 7,700 feet. The aircraft performs as if it were at 7,700 feet. FAA-H-8083-25C, Ch. 11 (Density Altitude Charts) The handbook gives the same method in Appendix C.
A rule of thumb for the arithmetic
The chart is the authority, but the numbers have a shape worth knowing for sanity checks. The conversion table is close to 1,000 feet per inch of mercury. Standard temperature at a pressure altitude is about 15 minus 2 for each thousand feet. And density altitude rises roughly 100 to 120 feet for each degree Celsius above standard.
Check it on the example. Pressure altitude 5,718 gives a standard temperature of about 3.6 Celsius; the actual 70 Fahrenheit is 21 Celsius, 17 degrees above standard, which at about 110 feet per degree adds roughly 1,900 feet: a density altitude near 7,600, close to the chart’s 7,700. The FAA’s own examples agree: 20 degrees above standard lifts a 5,000-foot pressure altitude to over 7,000, and a pressure altitude of 10,000 at 20 Celsius gives 12,700. FAA-H-8083-25C, Ch. 11 · FAA-H-8083-28B, Ch. 8.4.1.5 The “100 to 120 per degree” figure is my rule of thumb checked against those examples, not an FAA-stated rule, and the test hands you the chart.
§ 5.14 — GO OR NO-GO
The go or no-go decision
All of this ends in one act: you look at the weather and decide. The decision has three layers, in strict order of authority.
The first is the regulation: at least 3 miles of visibility from the control station, and 500 feet below and 2,000 feet from any cloud. If you cannot establish them because no local report is available, you do not fly until you can. 14 CFR § 107.51(c), (d) · AC 107-2A, ¶ 5.12.3 The second is the aircraft: its temperature limits and its wind, precipitation and gust limits. A window that is legal and outside the aircraft’s limits is a no-go. AC 107-2A, ¶ 8.12.2.5.1 The third is you. The FAA’s risk-assessment questions under the environment heading ask: what is the weather like, am I comfortable and experienced enough to fly in it, and have I left myself an out? AC 107-2A, App. A
That third layer is where personal minimums come in: limits tighter than the legal and manufacturer limits, set on the ground, calmly, before the day you are tempted. If the aircraft is rated for 20 knots and you have flown ten hours, you might set 12 gusting 18; if the legal visibility is 3 miles, you might want 5. The numbers are yours. What they buy is that when you stand at the site with a client and a deadline, the decision has already been made.
Run the same sequence each time: the METAR from the closest station that fits your terrain (wind and gust, visibility, ceiling, spread, altimeter), the TAF for the trend, any PIREP or chart, and density altitude if it is hot or high. Then look at the sky, which has the last word: cumulus building fast, a dark line of cloud closing in, a falling barometer or a gusting wind all say no, whatever the report says.
| Minimum flight visibility | 3 statute miles | 14 CFR § 107.51(c) |
|---|---|---|
| Distance below clouds | 500 ft | 14 CFR § 107.51(d)(1) |
| Distance from clouds, horizontal | 2,000 ft | 14 CFR § 107.51(d)(2) |
| Maximum groundspeed | 87 knots (100 mph) | 14 CFR § 107.51(a) |
| Standard sea-level pressure | 29.92 "Hg = 1,013.2 mb | FAA-H-8083-25C, Ch. 12 |
| Standard sea-level temperature | 15 °C = 59 °F | FAA-H-8083-25C, Ch. 12 |
| Standard lapse rate | about 2 °C per 1,000 ft | FAA-H-8083-25C, Ch. 12 |
| Pressure change with altitude | about 1 "Hg per 1,000 ft | FAA-H-8083-25C, Ch. 12 |
| Wind gust | 10 kt or more between peaks and lulls | FAA-H-8083-28B, Ch. 10.7.2 |
| Variable wind (VRB) | 6 kt or less | FAA-H-8083-28B, Ch. 24.4.3.5 |
| Fog seldom forms when the spread exceeds | 2 °C (4 °F) | FAA-H-8083-28B, Ch. 18.1.1 |
| Fog versus mist | Fog under 5/8 SM; mist 5/8 to under 7 SM | FAA-H-8083-28B, Ch. 24.3.1.2 |
| Ceiling | Lowest BKN, OVC or VV | FAA-G-8082-22, Ch. 3b |
| IFR / MVFR / VFR | Ceiling under 1,000 and/or vis under 3 / 1,000-3,000 and/or 3-5 / above 3,000 and above 5 | FAA-H-8083-28B, Ch. 3.4.2.14 |
| Cloud levels (AGL) | Low to 6,500; middle 6,500-20,000; high above 20,000 | FAA-H-8083-25C, Ch. 12 |
| Mountain wind caution | Over 25 kt suggests turbulence; over 40 kt across a barrier: caution | FAA-G-8082-22, Ch. 3b |
| Icing needs | Visible water and a surface temperature of 0 °C or colder | FAA-G-8082-22, Ch. 3b |
| Thunderstorm vertical speeds | Cumulus-stage growth over 3,000 fpm; mature updrafts past 6,000 fpm, downdrafts past 2,500 fpm | FAA-G-8082-22, Ch. 3b |
| Microburst | 1-2 mi across, about 1,000 ft deep, 5-15 min; downdraft to 6,000 fpm; headwind loss 30-90 kt | FAA-G-8082-22, Ch. 3b |
| Severe storm avoidance | At least 20 NM | FAA-H-8083-25C, Ch. 12 |
| Damaging hail | Over 1/2 inch | FAA-H-8083-25C, Ch. 12 |
| TAF coverage | 5 SM of the runway complex; 24 or 30 hours; issued 0000, 0600, 1200, 1800Z | FAA-H-8083-28B, Ch. 27.4 |
| Warm front speed | 10 to 25 mph | FAA-H-8083-25C, Ch. 12 |
You should now be able to
- Explain why wind, cold, rain, thin air and poor visibility each matter to a small drone, and apply the 3 SM and cloud clearance rules to a weather report.
- State the standard atmosphere (29.92 "Hg, 15 °C, about 2 °C per 1,000 ft) and use it to reason about pressure, temperature and density.
- Tell stable from unstable air by clouds, precipitation, turbulence and visibility, and recognize inversions, fog types and frost.
- Describe the three stages and hazards of a thunderstorm, the microburst sequence, and the conditions for icing.
- Tell cold, warm, stationary and occluded fronts apart by the weather each brings.
- Name the sources (1800wxbrief.com, aviationweather.gov, ASOS and AWOS) and read a PIREP, a winds aloft forecast and a weather depiction chart.
- Decode a METAR and a TAF token by token, including FM, TEMPO, BECMG and PROB groups.
- Find density altitude on the supplement chart, say why it cuts propeller efficiency, and make and defend a go or no-go decision.