Deep dive — charts
Reading a sectional
Real chart excerpts from the FAA test supplement you can pan, zoom, and tap. Every symbol explains itself, and a find-it mode asks you to locate things by name.
A chart is a language, and the legend is its dictionary
A sectional chart looks like noise for the same reason a page of a language you do not speak looks like noise. It is not a picture of the ground. It is a set of words, and each word is a symbol, a color, a line style or a tiny number, written in a grammar that never changes from one chart to the next. Learn the grammar once and you can read Idaho, then North Dakota, then a sheet you have never seen.
The dictionary is the legend. In the test supplement it is a page of its own, and the FAA’s Chart Users’ Guide is the long form. The habit this lesson builds is simple: when you meet a symbol you do not know, you do not guess, you look it up. The chart below does the lookup for you. Tap any airport, ring, tower or caution box and its legend entry appears in plain language.
Aeronautical Chart Users' Guide, VFR SymbologyOne more reason to learn the grammar rather than the pictures. According to the FAA’s September 2026 advisory, from October 26, 2026 the Unmanned Aircraft General test can show image-based questions cropped from the latest sectionals, not only the sixteen excerpts in the printed supplement. You may be asked about a region you have never seen. The five excerpts in the chart below are real and you can choose among them: Figure 22 (Coeur d’Alene, Idaho), Figure 26 (Jamestown and Cooperstown, North Dakota), Figure 21 (Minot and Garrison, North Dakota), Figure 23 (Savannah, Georgia) and Figure 20 (Norfolk, Virginia). They are practice ground for a method, not a list to memorize.
Airman Testing Community Advisory, September 2026Reading an airport’s data block
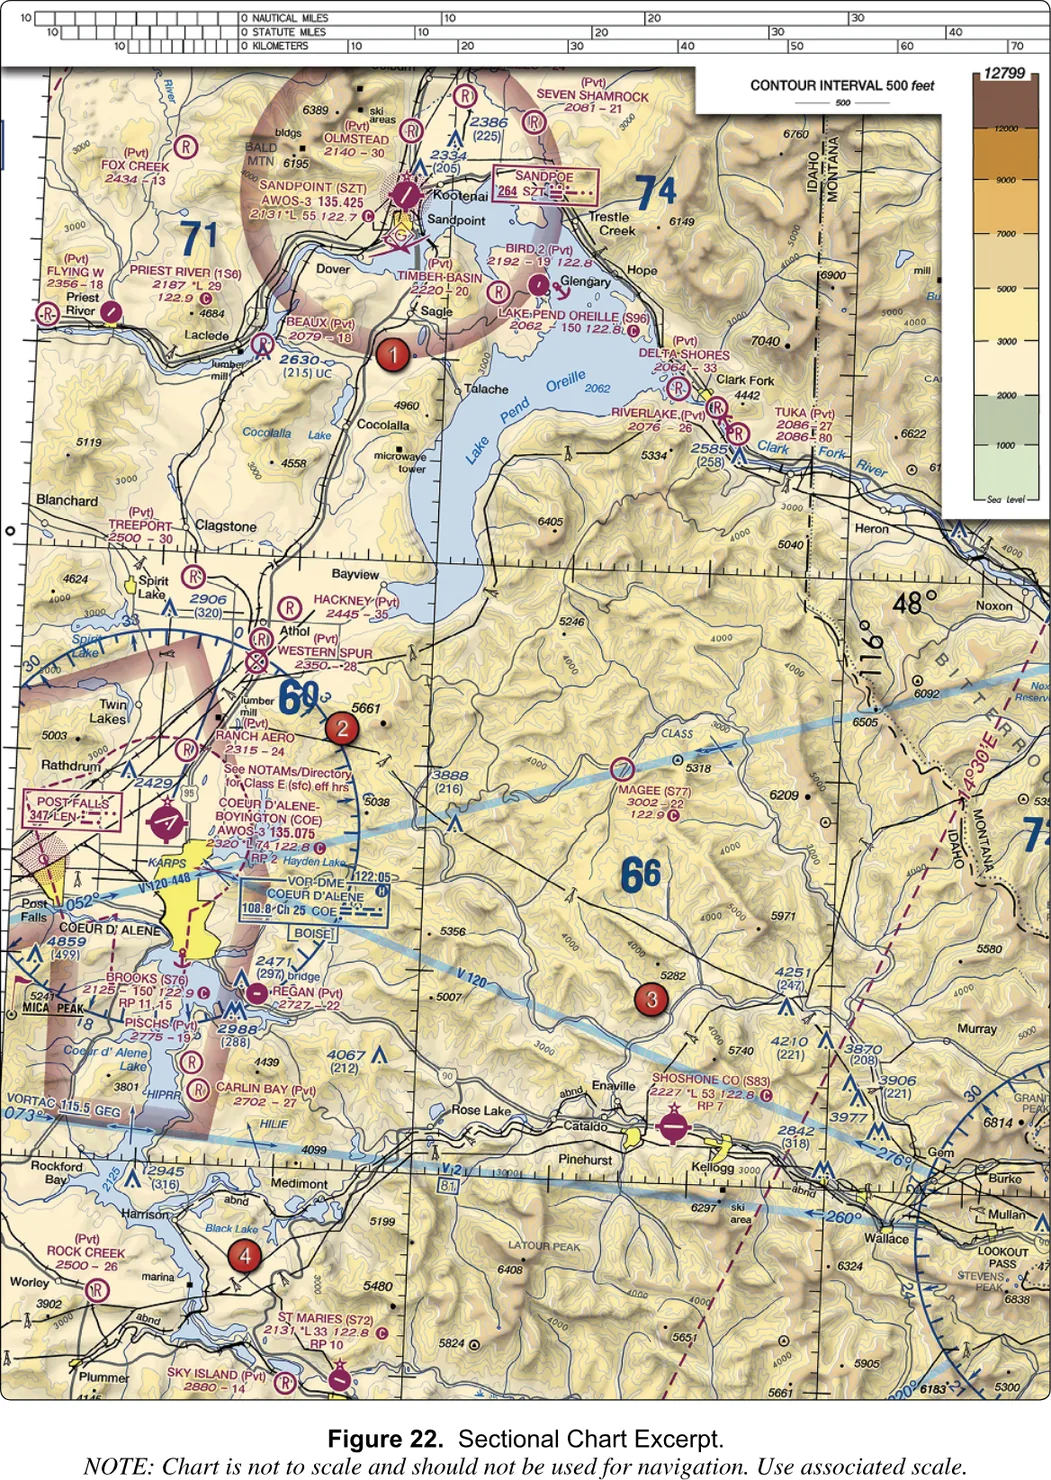
Start with Coeur d’Alene on Figure 22. The airport is a magenta circle with crossing runway lines, so no tower, and more than one hard-surfaced runway. Beside it is a block of text, and the block has a fixed order. Once you can read this one, you can read all of them.
Here is what the chart prints, line by line. First, in small type just above the name, a note: See NOTAMs/Directory for Class E (sfc) eff hrs. Then the name and identifier: COEUR D’ALENE-BOYINGTON (COE). Then the weather line: AWOS-3 135.075. Then the numbers line, 2320 *L 74 122.8, followed by a magenta disk with a white C. Then RP 2.
Take the numbers line left to right. 2320 is the field elevation, 2,320 feet above sea level. The L is the lighting code, runway lights from sunset to sunrise, and the small star in front of it means there are limits (for instance lights you switch on by radio), so you check the Chart Supplement. The interactive’s tap legend simplifies this to a plain L, so do not be thrown if the two differ: on the chart image the star is there. The 74 is the longest runway in hundreds of feet, so 7,400 feet. Then 122.8, with the circled C, is the CTAF, the frequency pilots use to announce themselves at an airport with no tower.
The AWOS line is the weather broadcast, not the traffic frequency. That is why the circled C matters so much: it is the only mark that says this number is where the airplanes talk. RP 2 means a right-hand traffic pattern for runway 2, the exception to the usual left turns. The note above the name is the odd one out. It says the dashed magenta line around the airport, Class E down to the surface, is not necessarily in effect all day, and that the hours are in the Directory and the NOTAMs. So the line tells you where the airspace is, and the note tells you to go and find out when.
Aeronautical Chart Users' Guide, VFR Terms and Symbols · Legend 1Obstructions and their two numbers
Towers, stacks and wind turbines are blue peaked symbols, and the ones the FAA can measure carry two numbers stacked together. The top number is the height of the top above mean sea level. The one in parentheses below it is the height above the ground. The Users’ Guide puts it just that way: the AGL height is in parentheses below the MSL elevation.
On Figure 22, a tower on the Mica Peak ridge reads 4,859 with (499) beneath it. The top is 4,859 feet MSL and the structure is 499 feet tall. Subtract and you learn something the chart never prints: the ground under it is at 4,360 feet. Your altitude limit is measured above the ground, so the number in parentheses is the one that answers your question; the one on top is what a pilot reading an altimeter needs. The letters UC beside a symbol, as on the 2,630 (215) tower on the same excerpt, mean the structure is under construction or reported but unverified, so treat its numbers as provisional.
Aeronautical Chart Users' Guide, VFR Terms and SymbolsThe red numbered dots
The FAA’s printed supplement marks places with red numbered dots, “area 2” and so on. A question cannot say “the airport near the lake”, so it points at a dot. The dot is not a thing on the chart. It is a pointer, and the question names the thing you should look at nearby. On Figure 22, area 2 sits in hill country northeast of the Coeur d’Alene airport, beside a bold blue 69, which is a maximum elevation figure of 6,900 feet MSL. The question that uses it, however, asks about the airport, so the dot only sends you to the right neighborhood. The new image-based questions drop the dots and name the airport instead.
A guided tour of Figure 26
Switch the chart below to Figure 26 and look at the top. A pile of blue-hatched shapes fills the upper part. Blue hatching is prohibited, restricted or warning airspace, and here it is restricted. R-5402 is the large circle, R-5401 is the small shape inside it, and R-5403 is a family of lettered pieces: A, B and C in the northwest, D, E and F in the middle. The chart shows special-use airspace in full even where areas overlap, which is why it looks like a heap. A boxed note gives a phone number for information on R-5402 and R-5403. You need permission from the controlling agency before you fly inside a restricted area.
Over them lies a magenta-hatched area labeled Devils Lake East MOA, with its own note saying it excludes the airspace of the restricted areas when they are active. Magenta hatching with a name and no number is a military operations area. Military pilots train there at speed. A gray line labeled IR678 with arrowheads runs across the scene: a military training route. The tap legends add where the floors, ceilings and hours live: in the chart’s margin, which is not part of these excerpts.
Now go south to Jamestown Regional (JMS). It is magenta, so no tower: 1,500 feet elevation, a 6,500-foot longest runway, ASOS on 118.425, CTAF 123.0. A dashed magenta line surrounds it, Class E to the surface, with arms reaching out along the approach paths. Authorization applies inside it. Around that line is a thicker, faded magenta band, the vignette for Class E starting at 700 feet above the ground. Then go northeast to Cooperstown (S32): 1,424 feet, starred L for limited lighting, longest runway 35, AWOS-3 on 118.75, CTAF 122.9. It has the faded band and no dashed line. Two small airports without towers, and one needs authorization and the other does not. The difference is entirely the line.
The reason is that your ceiling is 400 feet above the ground and the vignette’s Class E starts at 700. It begins above you, so you are still in uncontrolled Class G air, and the vignette does not touch you. A dashed line means controlled airspace to the surface, and 14 CFR § 107.41 requires prior authorization there.
14 CFR § 107.41 · 14 CFR § 107.45 · Aeronautical Chart Users' Guide, VFR Terms and SymbolsThree experiments
Use the chart below in explore mode first, then in find mode.
- In explore mode, switch on show every box. Each faint rectangle is something you can tap, so you see how much the chart is saying. Notice how crowded Figure 26 is compared with Figure 22. Then switch it off and tap Cooperstown, then Jamestown. Read both legends and name the single difference between them in one sentence.
- Stay in explore mode and tap each red dot on Figure 26, one through five. Before you read the legend, say aloud what the dot is sitting in: restricted area, vignette, MOA, nothing. Then check yourself against the legend text.
- Switch to find mode on Figure 22. The reader names a thing and scores your tap. The pool is airports, area dots, navaids and obstructions, six at a time. Run it until you can score six of six, then change figures and run it again. A figure you have not seen is a chart you have not memorized, which is exactly what the test may give you.
How the test asks it
FAA-CT-8080-2H, Figures 20, 21 and 22 · Aeronautical Chart Users' Guide, VFR Terms and SymbolsWhere to go next
If the three experiments went well, you now know the grammar: color first, then the line, then the numbers with their units, then the note. The airspace lines are the next layer, and the chart’s airspace rings peels them apart one class at a time. Finding a place from a coordinate is a separate mechanical skill, practiced in latitude and longitude. And the long-form version of everything here, with the rules behind the symbols, is in the charts chapter.
Tap anything on the chart.
Real excerpts from the FAA testing supplement. Drag to pan, pinch or scroll to zoom. Since October 2026 the test can show you a current sectional of any region; the symbols and the reading method are the same as on these.